
OPENGYM
Improving gym efficiency by helping students find the best times to work out
I was the Project Lead in Product Studio, a student-run club at Carnegie Mellon University, where I guided a 15-person cross-functional team through research, design, and product direction. Our project focused on improving students’ gym experiences by helping them find optimal times to work out.
Role
Head of Product & Design
Product direction, design, and research
Duration
6 months
Team
15 designers, engineers & product analysts
PROBLEM SPACE
Gym facilities at CMU are often crowded, making working out and healthy habits hard to maintain.
This turns what should be a positive workout into a frustrating experience.

SOLUTION SNAPSHOT
With Open Gym, students can quickly see how busy campus gyms are and choose the best time to work out.
"Instead of guessing or walking into an overcrowded gym, I can check Open Gym first and go when it’s less packed."
We launched this platform in February 2025.
Reaching 80 users at launch and a 95% data accuracy. Won CMU Impact Design Showcase and presented to the Google Pittsburgh office.
RESEARCH
Interviewing 14 students.
We validated the problem that the gym's busy-ness impacted CMU students' gym experience.
and found a few key insights:
Over 90% of gym inflows are directed to the Cohon University Fitness Center.
INSIGHT 1
We should prioritize the Cohon University Fitness Center first floor in our MVP.
Students who don't go to the gym often feel a sense of intimidation, especially for the first floor (where most of the weights are).
INSIGHT 2
How can we reduce uncertainty and pressure for beginner gym-ers? Especially for the first floor?
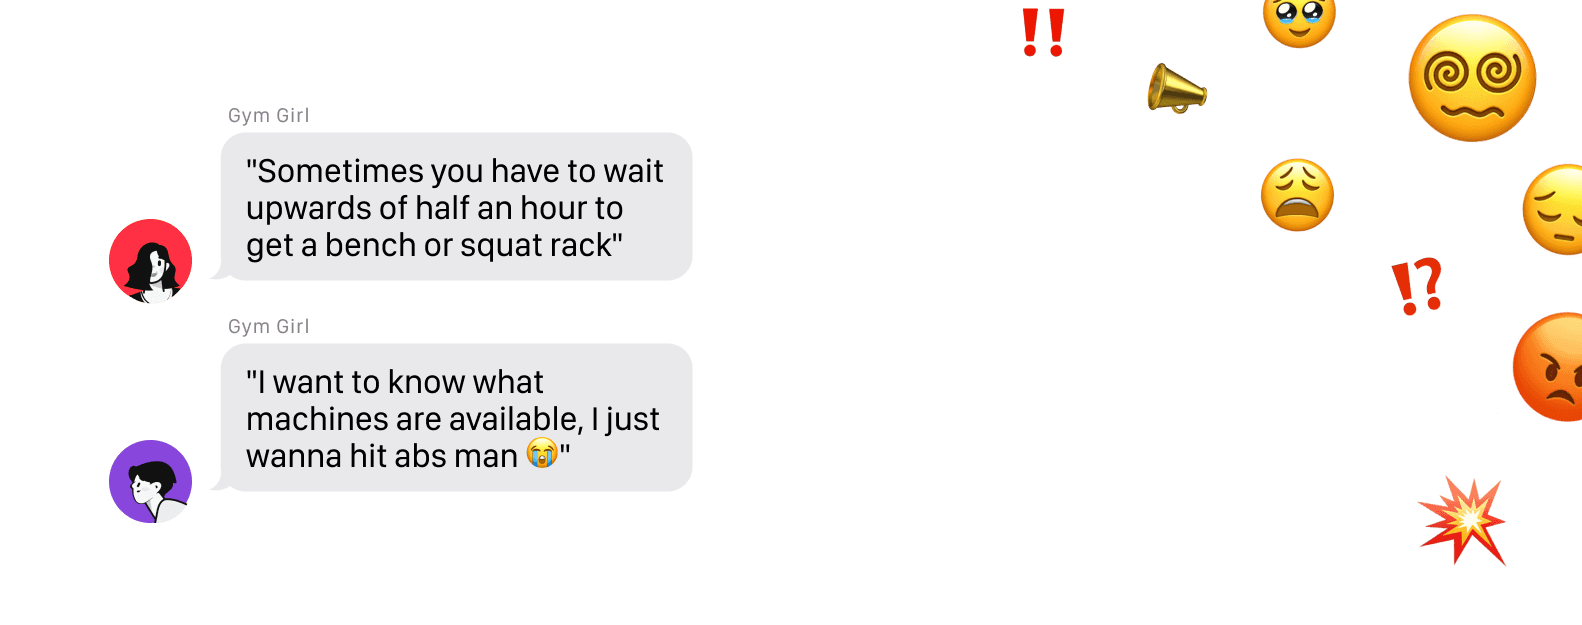
But as we were listening to people's pain points, we saw this reoccurring statement of wanting more information about how many people or machines were available, or the flow of the gym, etc.
So we found that ultimately, a key pain point lied within wanting more context of occupancy of the gym.
KEY INSIGHT
How might we help students identify busy gym times through occupancy data?
✦ SO ULTIMATELY,
Priority 1 (P0): How might we provide more context to CMU students about the busy-ness of the gyms so they can make better decisions before they go?
IDEATION
So within this space, we began to ideate on few feature ideas that could help tackle this question.
IMPLEMENTATION CHALLENGE #1
However, we knew that a big hurdle would be engineering feasibility.
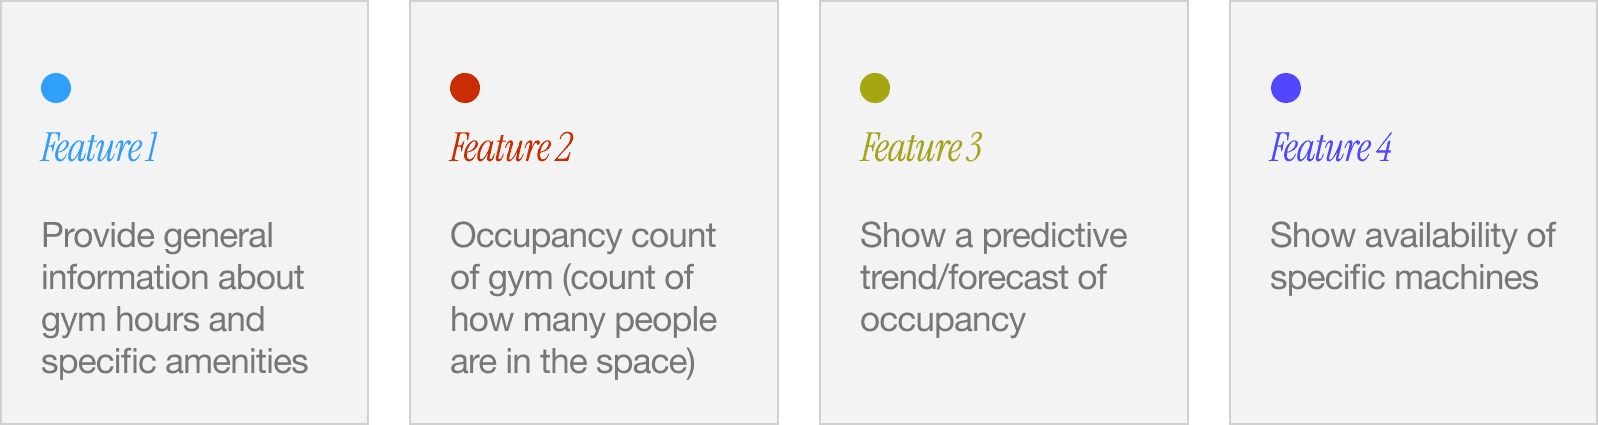
Since our team included engineers with varying levels of experience, we decided to prioritize a few features for our MVP:

For our MVP, we focused on the first three features, knocking out that fourth feature.
Note: It’s worth noting that implementing machine occupancy tracking would be significantly more challenging. We’d need a system to detect whether someone is sitting at or actively using each machine, and that would require hardware or sensing solutions installed across all units.
But, how did we actually collect the data to complete these features?

Feature 1 relied on data that could be gathered from public websites, while Feature 3 depended on access to the data required for Feature 2. Rather than implementing our own tracking system, we wanted to explore existing ways to obtain accurate data on how many people were entering and leaving the gym.
We knew that CMU administrators would have some form of that data. Considering COVID, they would need to keep track of how many people were in the gym. So, we reached out to them
IMPLEMENTATION CHALLENGE #2
With CMU admin, we had several discussions about data privacy and identifiability.
The data that we could be collecting could included sensitive information like Andrew ID numbers and usernames—which could be traced back to students' names, ages, and personal information. Because of this, admin was extremely cautious about what they'd share with us.
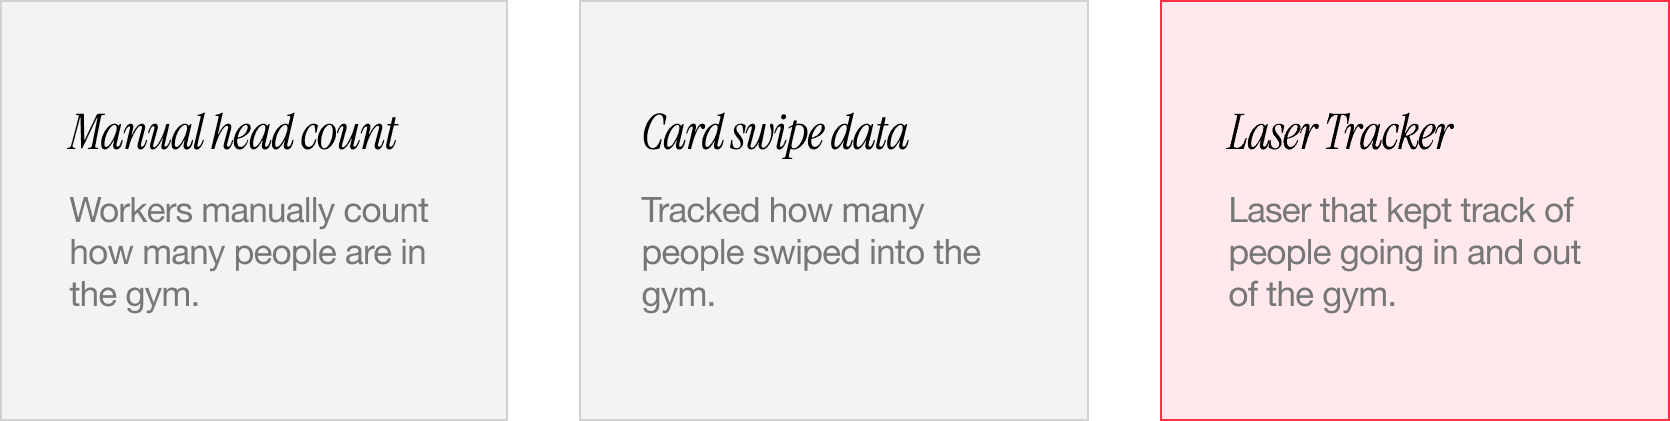
In the end, we were able to get two types of data:

To make sure we had no access to any private information, we ended up narrowing it down to just two google spreadsheets—both containing just a number count of people going in and out of the gym.
However, manual headcount data would only be updated every 2 hours, and card swipe data was updated every 15 minutes. And we wanted live data.
So, we engineered a third data stream: a physical laser tracker that counted people entering and leaving the gym in real time.
And after many months of engineering, this laser tracker was designed & engineered.

DESIGNING
And all this engineering, data and backend work helped shaped the designs that we were visually representing into a few different iterations and fidelities.
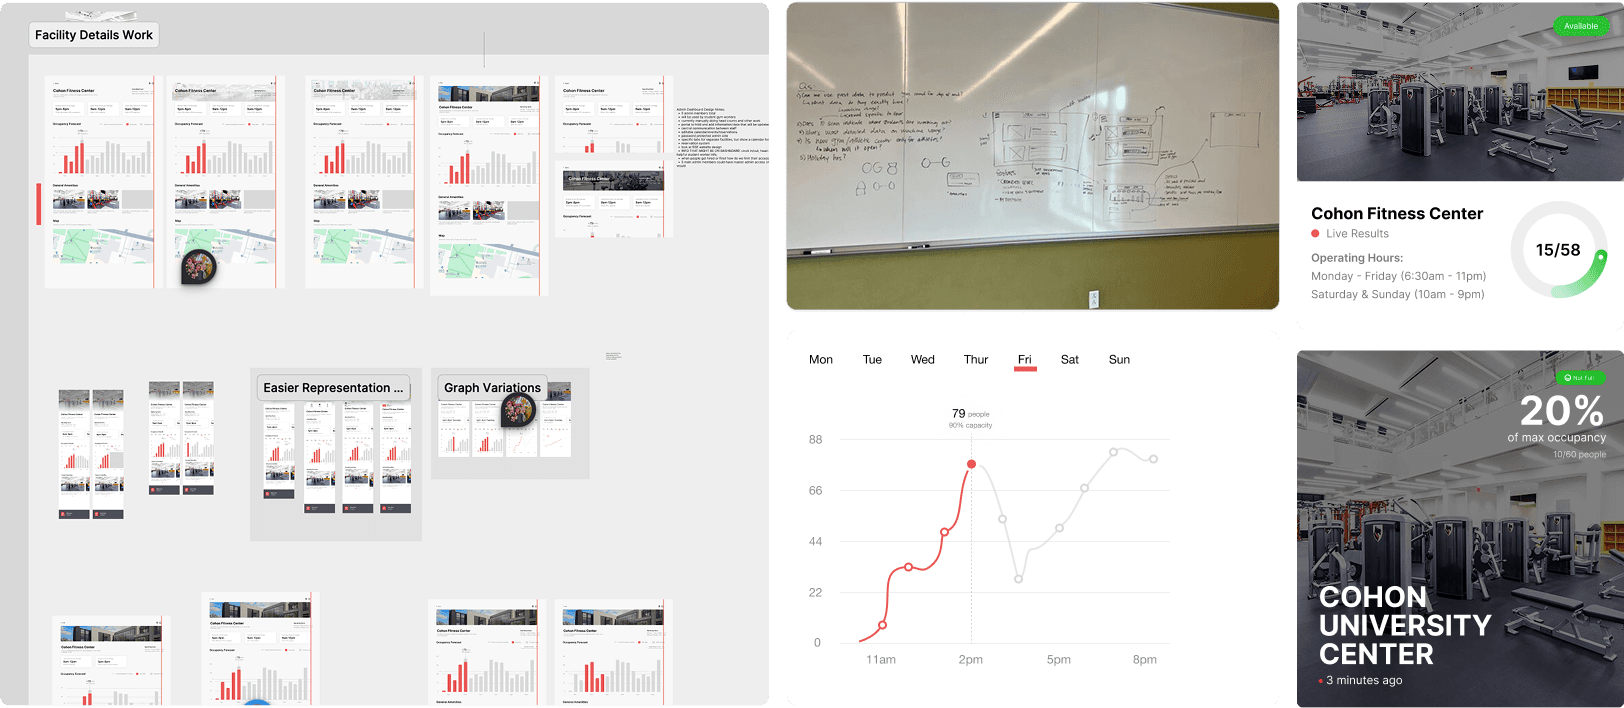
DESIGN EXPLORATION
We knew college students didn’t want to spend time to analyze things to understand, so we focused on the details of how to represent the data in a very visually scannable way.
When students go on the platform, how would they be able to tell that this gym is empty versus full?
We initially started it off by using a color tag to show availability.

But then, after conducting a competitive analysis of some of other colleges and how they represented occupancy,

we saw a meter design to be more effective and provided more context into occupancy of the gym. which led to several different design iterations following that same line of thought.

We did some short user testing with 5 people,
and found that this metered design with the occupancy count provided more effective information and visual context to help make better decisions.

DESIGN TESTING
This metered design also raised the question of: numerical representation or percentage?
Should the data be represented in a numerical form, so for example, 15 people out of the 50 max occupancy, or 30%?
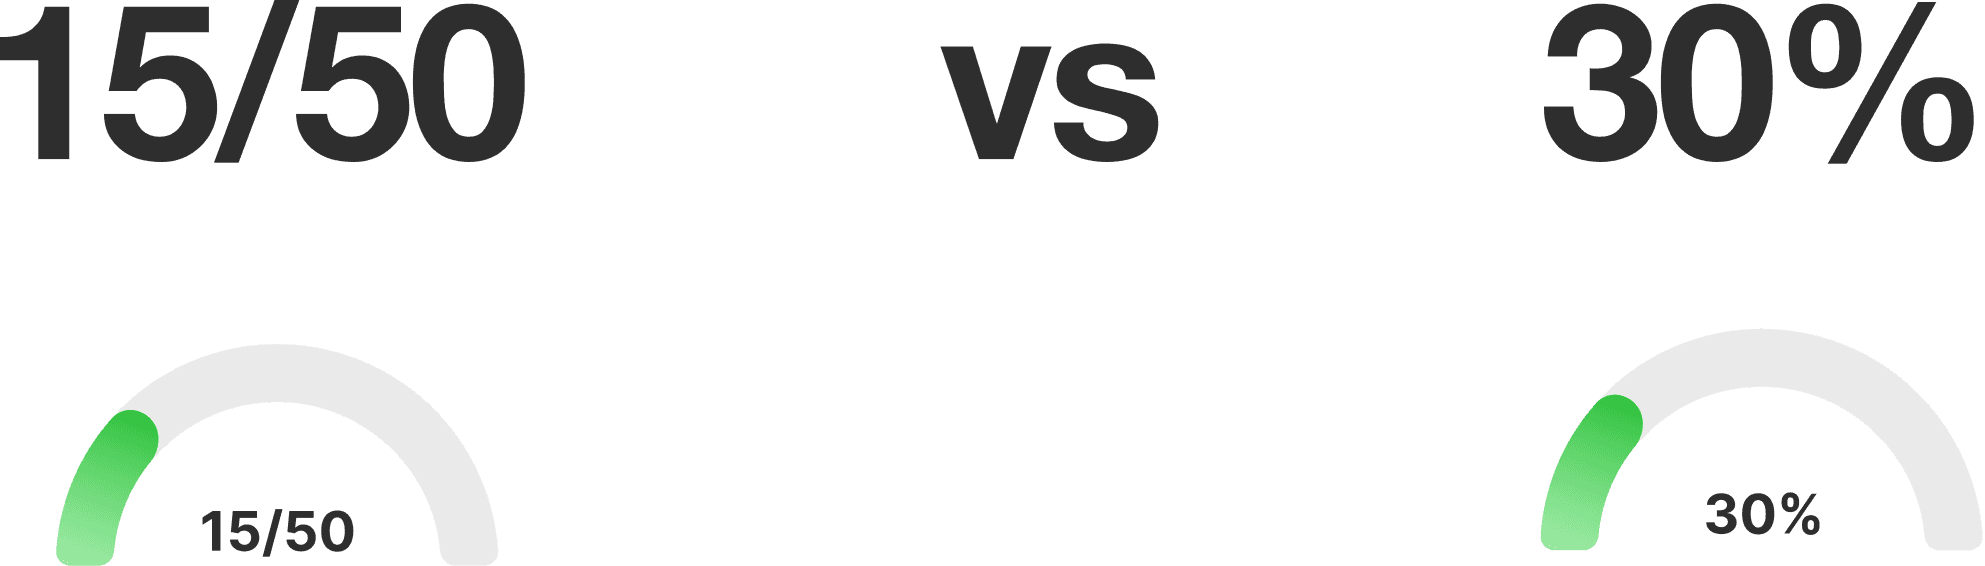
After testing on 2 participants, we found something interesting:
Percentages were easier to interpret and easier to feel how busy the gym was.
When participants looked at numbers ("15/50"), it took longer for them to decide whether it was busy or not as busy compared to percentages.

FINAL DESIGNS
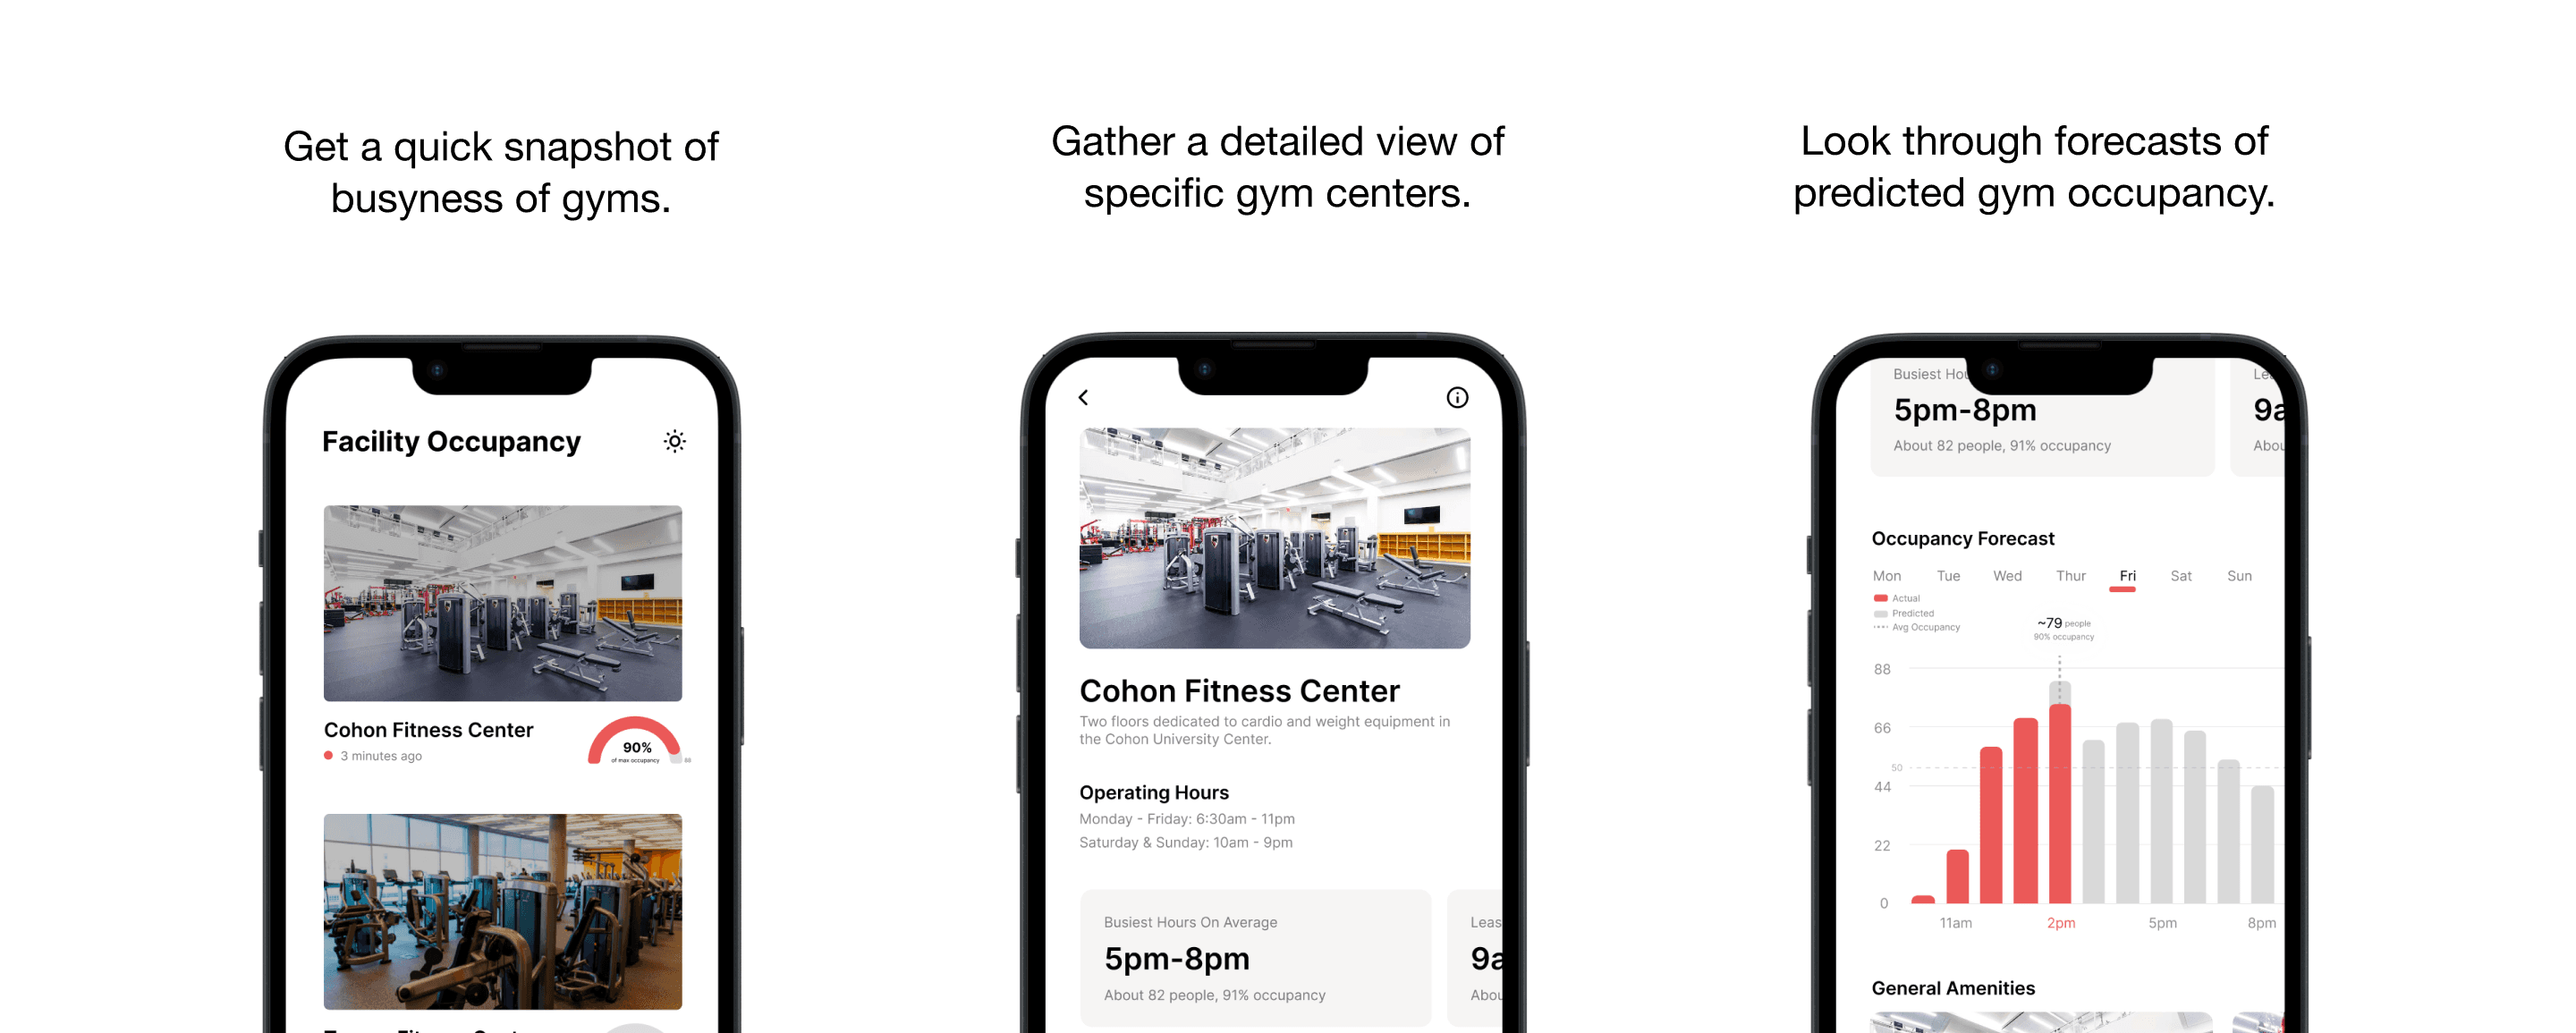
Introducing OpenGym. Providing real time data of gyms on campus.

At a glance gym busyness
A color-coded meter that gives students an immediate snapshot of how busy each campus gym is. Students can quickly decide whether to go now or plan for a less crowded time without needing to interpret numbers or charts.

Occupancy forecast & planning view
A predictive occupancy forecast that helps students anticipate when the gym will be busy or less crowded and students can plan workouts with confidence. This detailed view reduces gym intimidation by setting expectations ahead of time and makes gym planning faster and less stressful.
Click into a gym for a detailed view
A dashboard of information that empowers students to make smarter decisions about when to go to the gym.


Login System Ensuring Security
To ensure security of student data, we established a login that goes through the two-step integration system before showing any sensitive data (ex: occupancy of gyms)
IMPACT
We presented our project at the Google office in front of 4 product managers and 1 product designer. Gratefully, after the presentation, we got much praise, including this one!
"With this presentation, you all would pass the product manager interview at Google.” -Scott Bluman, PM at Google
This platform launched as of February 2025.
A few days after launching, we tested our data and found a 95% data accuracy level and had over 80 users during our launch.
Check it out here! ↴
https://cmuopengym.com/
Note: you need a CMU email to login!

MY TAKEAWAYS
Especially within cross collaborative teams, creating these discussions were able to keep us on the same page and hear everyone ideas.
I would have loved to do more usability testing in the early stages. Especially as the designs were being created, like lofis.
This project had such a huge focus on implementation, and it showed me the importance of considering technical and physical constraints early when designing end-to-end products.